The Reporting & Analytics module allows users to build, organize, and arrange their own custom reports with the data they need from Limo Anywhere as well as check their monthly/yearly sales.
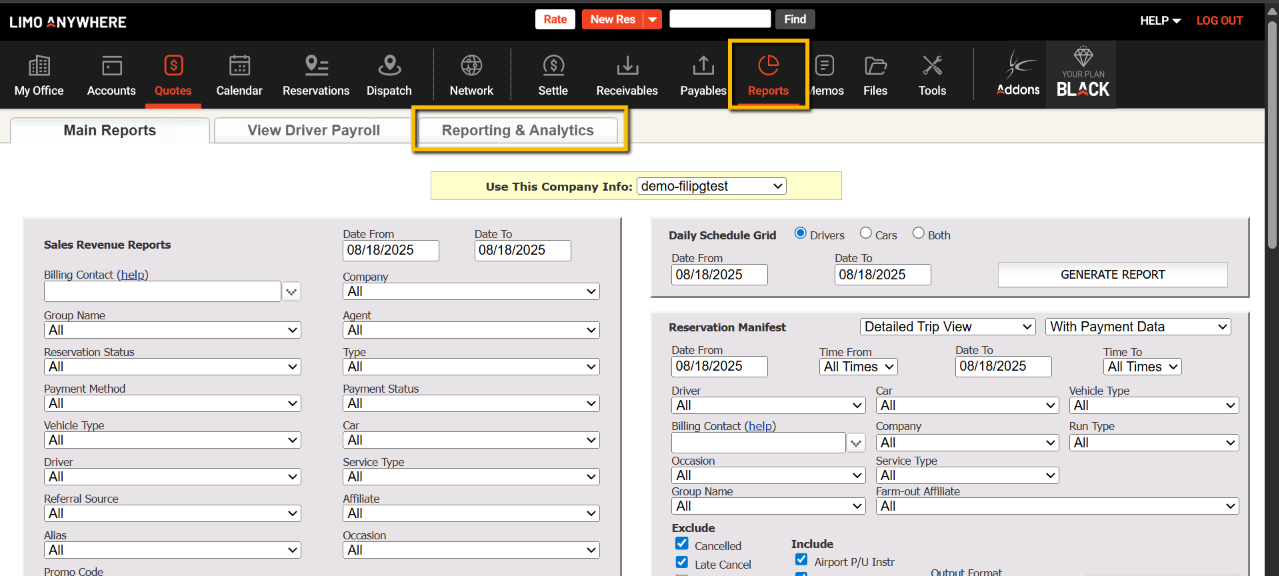
Reporting & Analytics is located under Reports > Reporting & Analytics tab.
Generating a Report
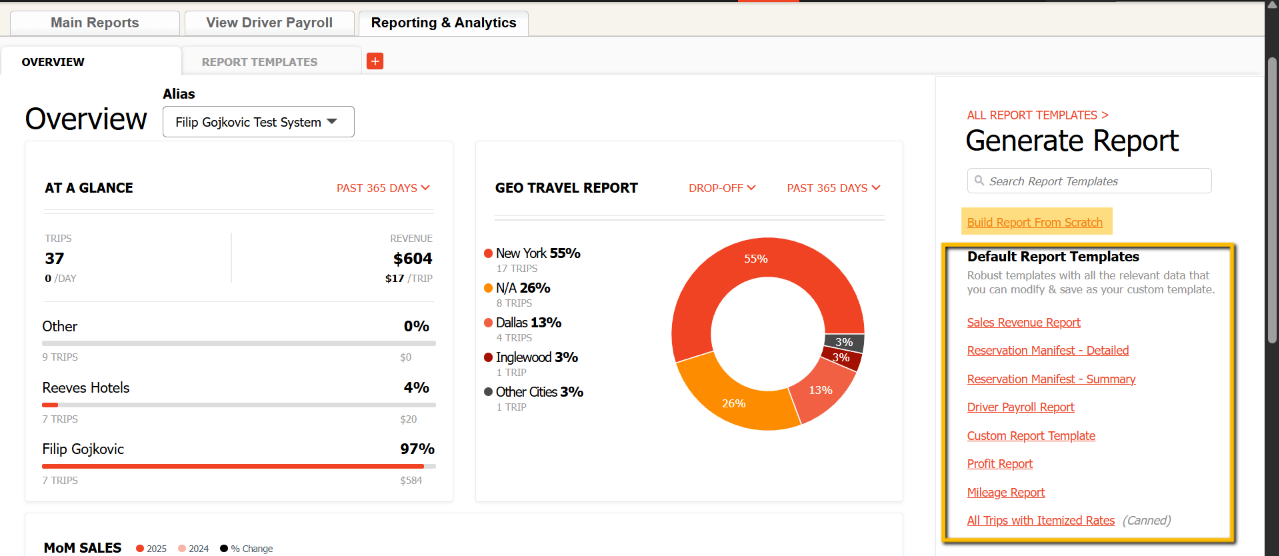
The initial screen you will see in Reporting & Analytics is the overview screen. Here, you can check your sales, choose one of the premade templates or even create your own template and generate reports by picking the template and date range.
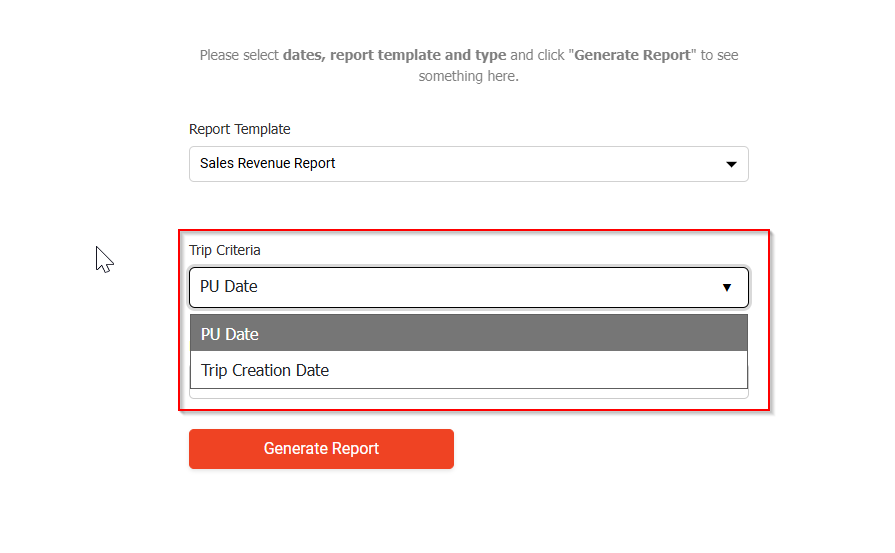
After choosing the R&A report, you will be prompted with the following options.
Trip Criteria
Clicking on the Trip Criteria option, you will be able to determine whether you would like to have the report generated with the Pick-Up Date or the Trip Creation Date (Booked Date) in mind. This is the first option and cannot be amended with the options existing in the Filter or Columns fields later in the report adjustments.
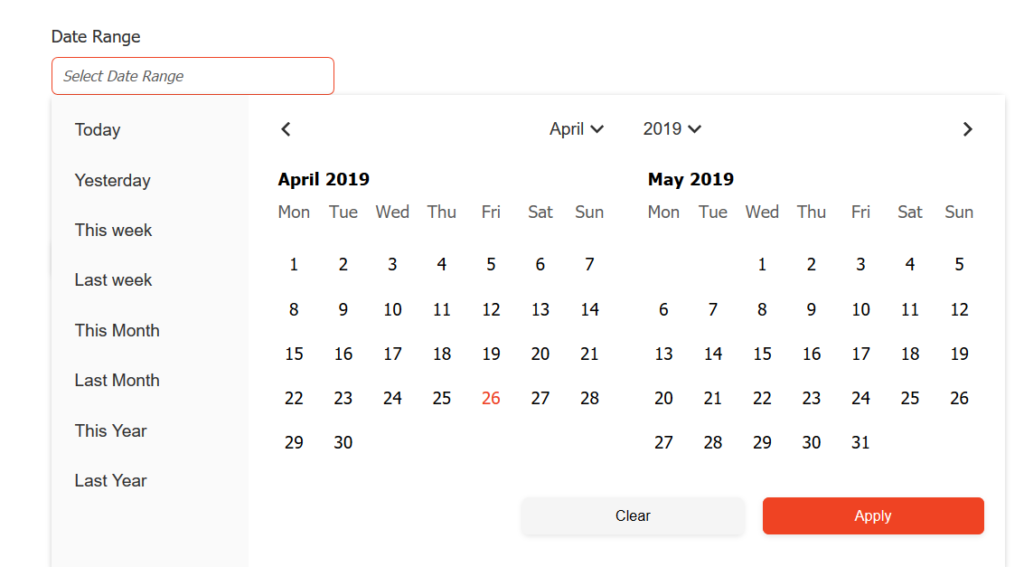
Date Range
Clicking the Date Range field will bring up the date picker. Here, you can manually select the date range or select a pre-filled one from the left side (Today, Yesterday, This Week, Last Week, etc).
Select Report Template
Select the Report Template that you want to generate via the dropdown.
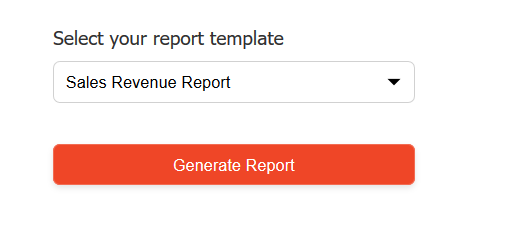
Click Generate Report once the date range and template are set.
Report
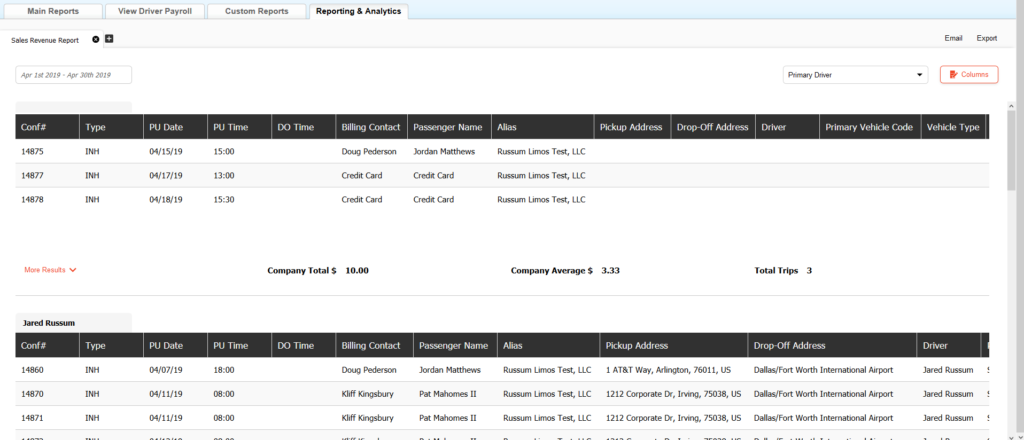
Once the report is generated, you will see the report as shown bellow. The layout is in rows and columns, much like a spreadsheet.
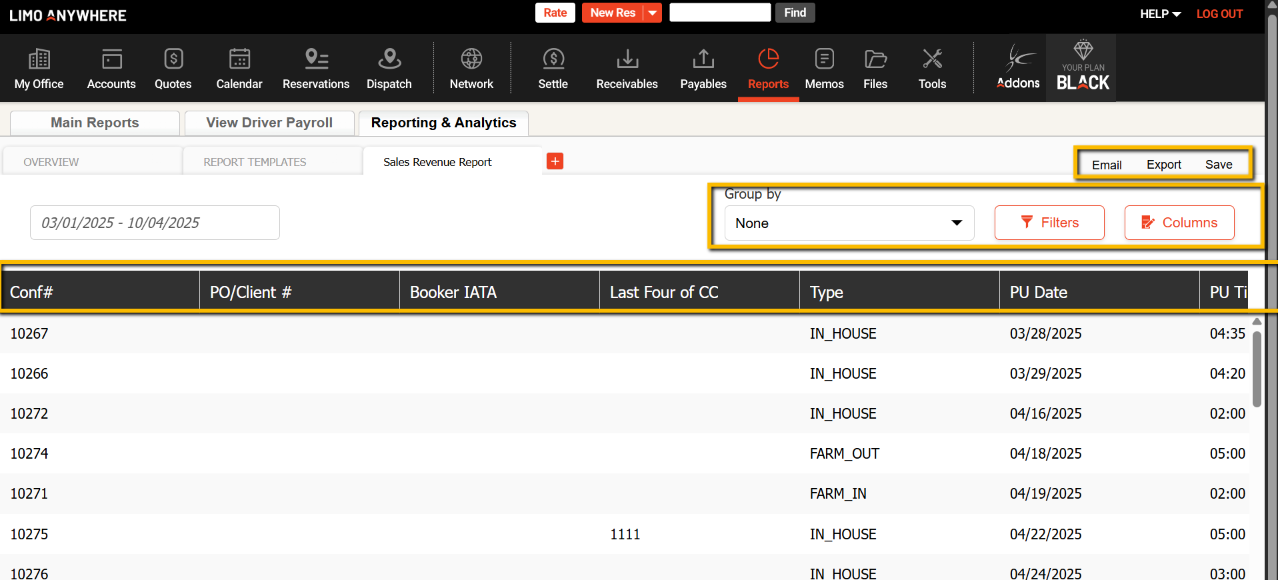
While on the report, you can edit the Columns and Filters of the report to your needs, either removing or adding different columns that otherwise may not be available in a certain report.
You can also email the report, export it as a PDF or CSV/Excl file and you can also save the report.
Doing so will save the columns and/or filters you have applied for future use, without the need to create the report from scratch every time.
Edit Columns on Report
You will be able to move, resize, edit the name of, or delete the columns. If you hover over the column, you will see icons for different options.
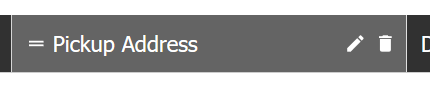
- 2 Bars – Allows you to drag and drop the column to the left or right
- Pencil – Brings up the ‘edit column data’ window to edit the name of the column header or change the data present in the column
- Trash Can – Will remove the column from the report
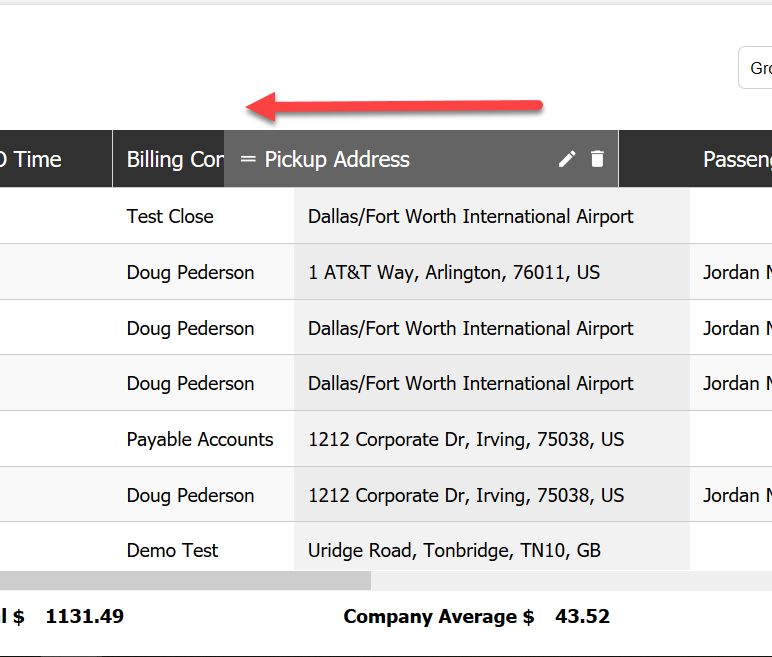
Dragging Columns on Report
Click the 2 Bars on the column to drag it to the left or right.
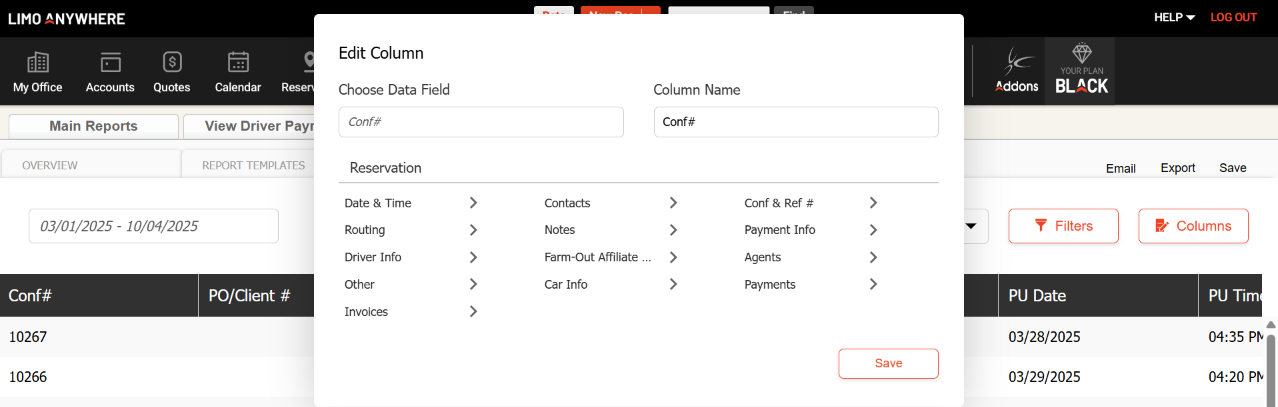
Editing Column Header Names or changing Column Data
Clicking the Pencil icon will bring up the ‘Edit Column Data’ window. Here, you can change the name of the Column Header and also change the data that the column will show as needed.
Editing Column in Column Window
Clicking the ‘Columns‘ button on the top right of a report will bring up the following window.
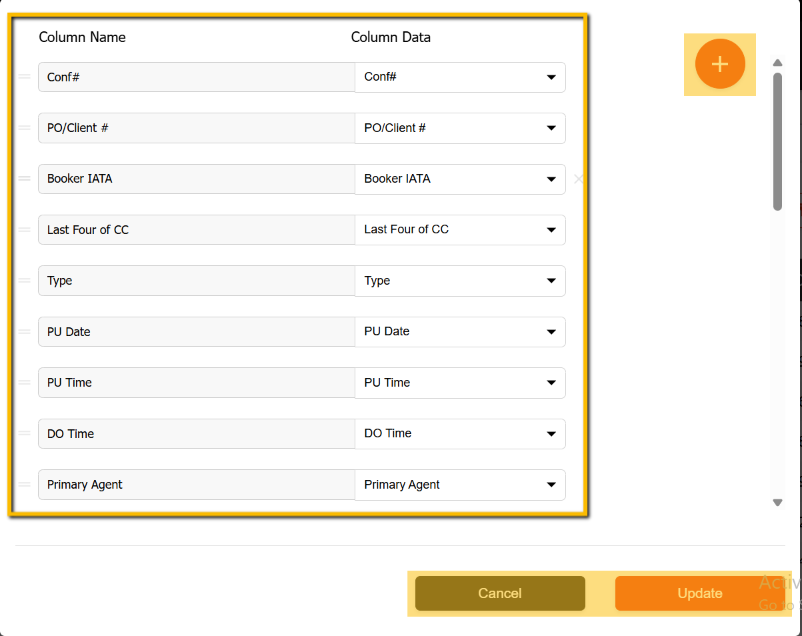
In the window, you can arrange, edit names, edit data, and add columns for the report.
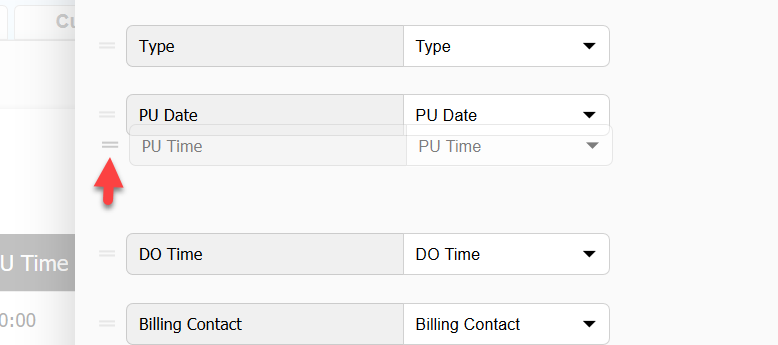
Arranging Columns in Column window
Clicking on the two Bars to the left of the Column Name will give you the ability to drag and drop the columns. You can arrange the columns in the order you need easily here in this window.
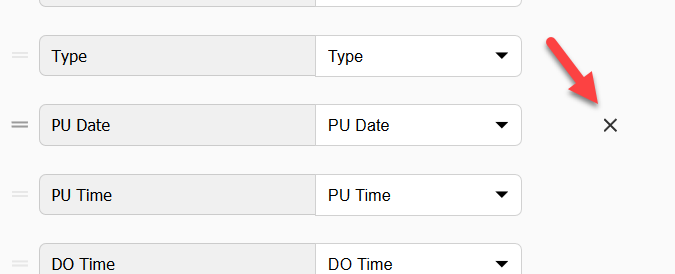
Deleting Column in Column Window
Click the “X” to the right of the Column Data to delete the column from the report.
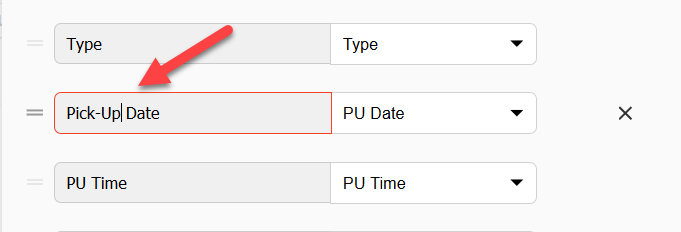
Edit Column Name in Column Window
Clicking the Column Name field will allow you to edit the Column Header Name.
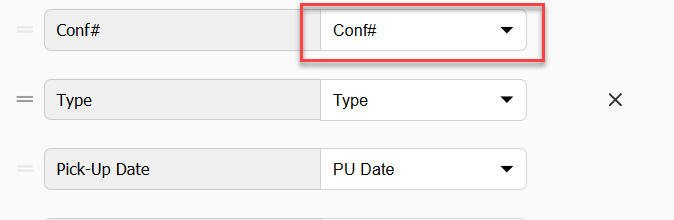
Changing Column Data in Column Window
Clicking on the Drop Down in Column Data will bring up a menu from which you can change the Column Data for that column.
Adding a Column in the Column window
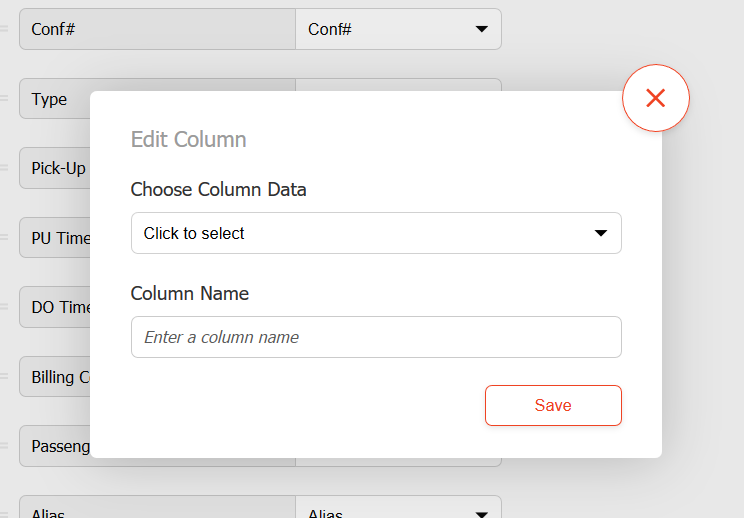
Clicking the big, red plus in the Column Window will bring up the Add Column window. From here, you can add any column that you’d like.
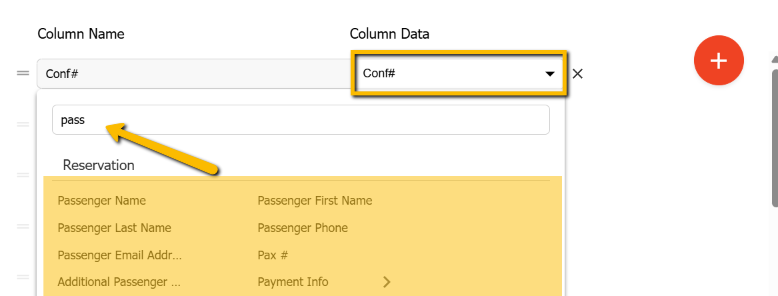
Searching and Selecting Column Data to Add to Report
When you click on the “Choose Column Data” drop-down it will display a menu from which you select the data you would like to add to your report. You can Search for a particular piece of data or go through the menu to select what you want to add.
Once you click on what to add, it will take you back to the Add Column window to edit the name if needed and Save. Once saved it will show on the Column window at the bottom to arrange the newly added column if needed.
Click Update at the bottom of the Column Window once your are ready to save your additions and changes to the report.
Grouping
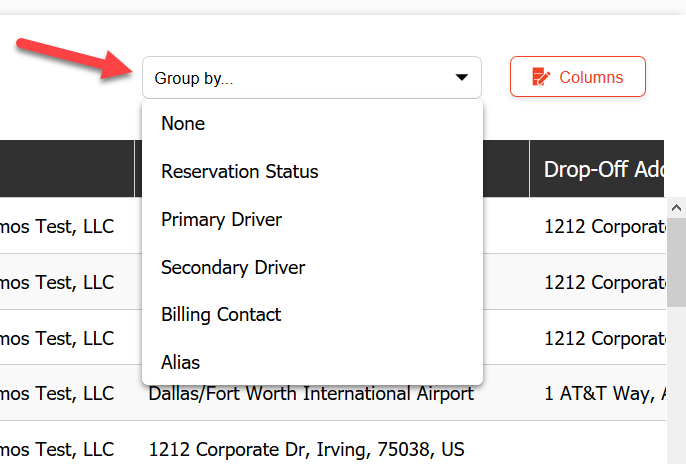
After generating a report, you can use the “Group By” feature to group reservations on the report.
Choose how you want to group the reservations by selecting from the drop-down menu to the left of the columns button.
After selecting, the report will re-generate and look like the image below. (In this example, we grouped by Driver)
Filtering
After generating a report, you can use ‘Filters’ in order to Show and/or Hide specific data points on a report. This can provide a level customization to narrow down the results on a report.
Click on the ‘Filters‘ button to open the ‘Filters‘ window.
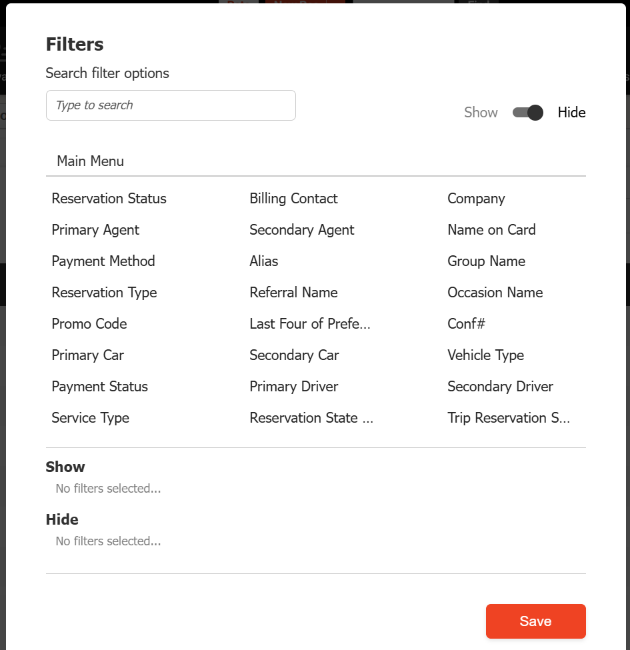
There is a toggle in the top right of the ‘Filters’ window to toggle between ‘Show’ or ‘Hide’. Select ‘Show‘ or ‘Hide‘ before selecting a filter.
- Show – will narrow down the report to only show reservations that meet the criteria
- Hide – will narrow down the report to not show reservations that meet the criteria
You can add as many filters to ‘Show‘ and/or ‘Hide‘ that you need to for a report.
You can search for filters by typing in the ‘Search filter options‘ box or you can select the filter under the Main Menu.
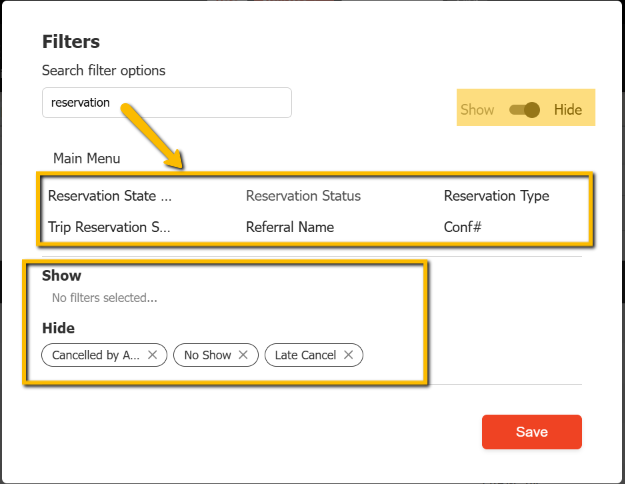
Once a filter has been selected, you can choose or type in exactly what you want to ‘Show‘ or ‘Hide‘. Once selected, it will display your selection under ‘Show‘ or ‘Hide‘ depending on the toggle that was set.
Example 1: I want a report to hide all reservations with a ‘Cancelled‘ status. I would have toggle to ‘Hide‘ and select ‘Reservation Status‘ then select all ‘Cancelled‘ statuses (Cancelled, Cancelled By Affiliate, No Show, etc.) and ‘Save‘.
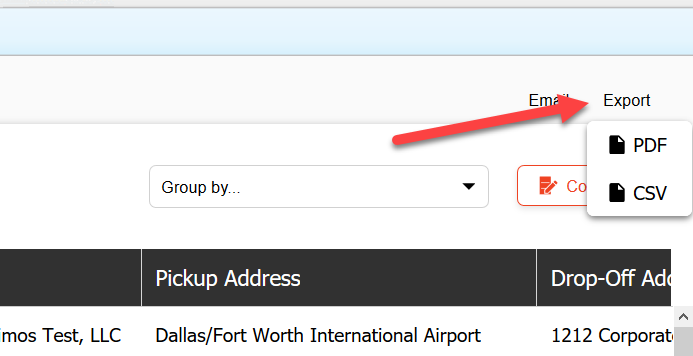
Exporting
After the report is generated and exactly how you want you can export that report into PDF or CSV.
Click the ‘Export‘ menu in top right of Report & Analytics and select PDF or CSV and it will start exporting the report in the format chosen.
Multi-Tabs
Reporting & Analytics has a Multi tab feature to allow you to generate multiple reports and then switch between tabs to compare the data.
Click on the Plus next to the tab at the top left of the Reporting & Analytics screen.
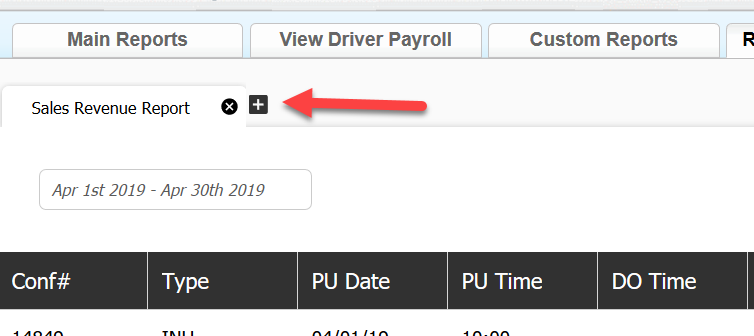
The tab will open and you will see the initial screen to generate a new report.
Saving a Custom Report
Reporting & Analytics allows you to create a custom report and save that custom report so you can easily generate it at the click of a button in the future.
Saving a report will save:
- Group By
- Filters
- Columns and Column Order
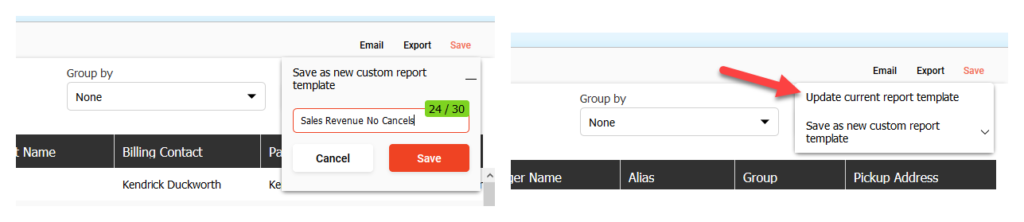
After you generate your report and get it customized and organized how you want, you can click ‘Save‘ in the top right of the Report and save it as a new custom report template. Type in a name for the report and click ‘Save‘.
If you have already saved this custom report before and have updated it, you can choose ‘Update the current report template‘ or ‘Save as a new report template.’
Note: The report name is limited to 30 alphanumeric characters.
*Many more features are coming please stay tuned.