The Trips by Date report displays a calendar-style heat map showing how many trips you have scheduled on each day. It covers a rolling six-month window — three months back and three months forward from today — so you can review past volume and see what’s coming up.
How to Access the Report
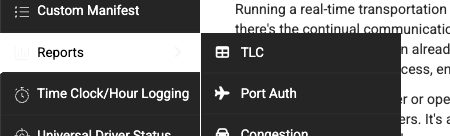
- Navigate to Reports > Trips by Date in the left sidebar

Reading the Calendar
The report shows several months of calendars arranged side by side. Each calendar day displays:
- The date number in the top-left of the cell
- The trip count — the number of trips scheduled for that day, shown as a large number in the center of the cell
Today’s Date
Today’s date is highlighted with a green border and a subtle glow effect, making it easy to spot where you are in the calendar.
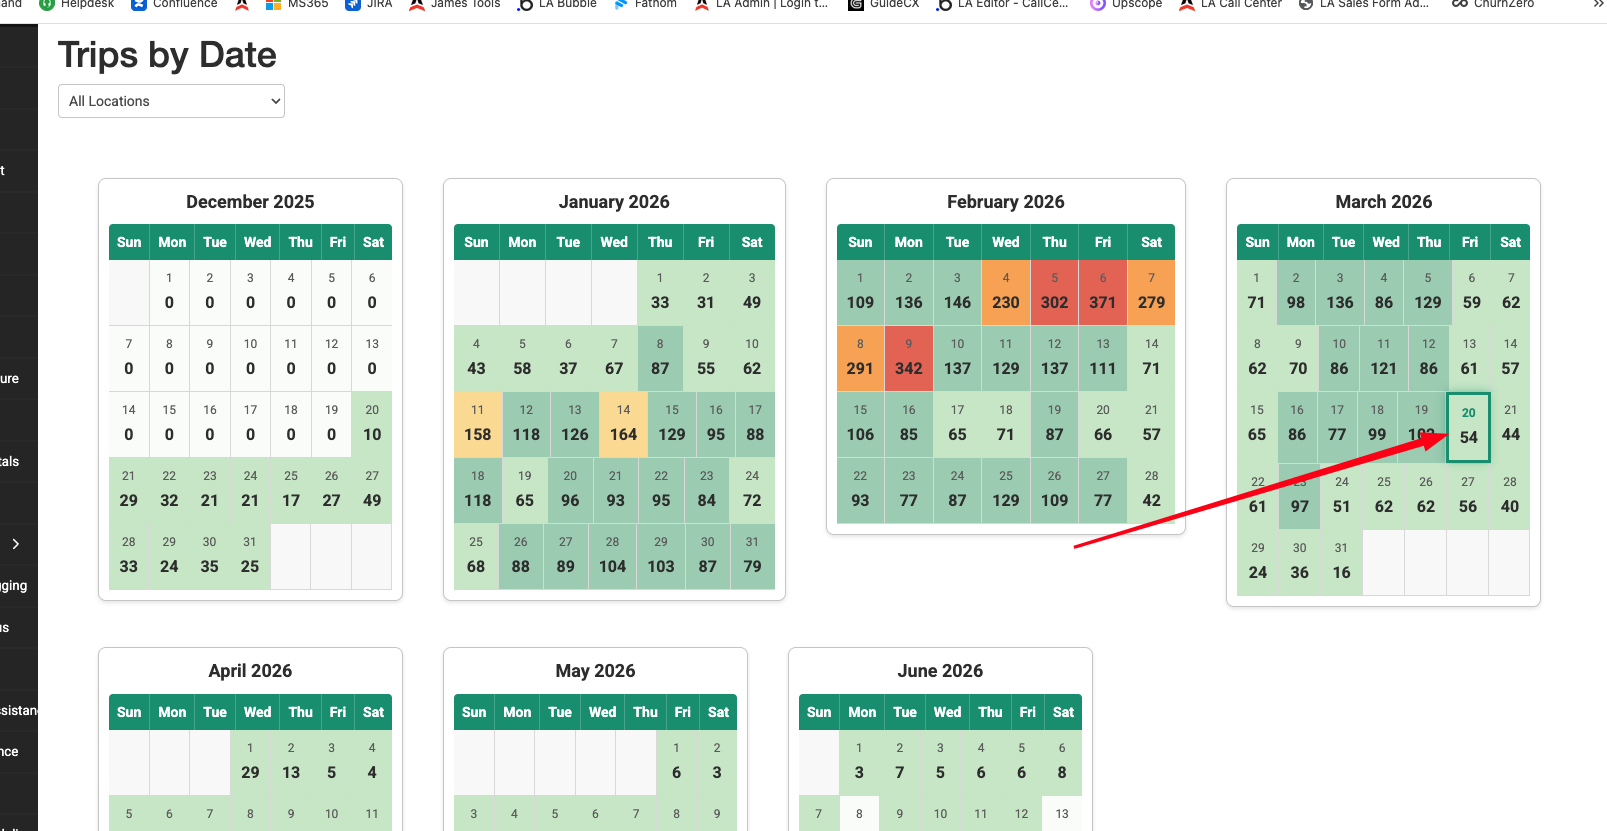
Color Coding
Each day is color-coded based on how busy it is relative to your busiest day in the entire range:
| Color | Meaning | Range |
|---|---|---|
| Very light green | Empty | 0 trips |
| Light green | Low volume | 1–20% of your busiest day |
| Medium green | Medium volume | 21–40% of your busiest day |
| Yellow | Moderate volume | 41–60% of your busiest day |
| Orange | Busy | 61–80% of your busiest day |
| Red | Very busy | 81–100% of your busiest day |
A legend is displayed below the calendars for reference.
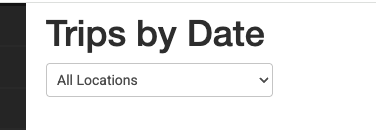
Filtering by Location
Use the Location dropdown at the top of the page to view trip counts for a specific company location only. Select a location and the calendar will automatically refresh.
To return to the full view, select All Locations from the dropdown.
Drilling Down into a Week
Click on any week row in the calendar to open the Trips by Hour report for that week. This lets you see the hourly breakdown of trips for the selected Sunday-through-Saturday period.
- If you have a location filter active, it carries over to the Trips by Hour report automatically
- The week row highlights when you hover over it, indicating it’s clickable
This drill-down feature makes it easy to go from a high-level view (“Tuesday looks busy”) to a detailed view (“Most of those trips are between 8:00 AM and 10:00 AM”).

Tips and Best Practices
- Use the calendar for capacity planning. Scan upcoming weeks to spot days with unusually high volume so you can schedule extra drivers or vehicles in advance.
- Identify trends and patterns. Look at whether certain days of the week are consistently busier. For example, if Fridays and Saturdays are always orange or red, that’s your weekly peak.
- Compare months at a glance. Since multiple months are visible at once, you can quickly see seasonal trends — busy holiday periods, slow summer weeks, etc.
- Click into busy weeks for detail. When you spot a particularly busy day, click that week to jump into the Trips by Hour report and see exactly which hours are driving the volume.
- Filter by location for multi-branch operations. If different branches have different busy patterns, use the location filter to plan staffing for each one separately.
Troubleshooting
- All days show 0 — Make sure you have trips with pickup times within the displayed date range. The report only counts trips based on their scheduled pickup time.
- Times or dates seem off — The report converts all pickup times to your system timezone. Verify your timezone is set correctly under Settings > System.
- Location dropdown is empty — Your account may not have multiple company locations configured. The dropdown will only show locations that have been set up in your system.
- Clicking a week doesn’t open anything — Make sure pop-up blockers are not preventing navigation. The click opens the Trips by Hour report in the same browser tab.