The Trip On-Time Performance Report helps you track how punctual your drivers are by comparing their actual arrival and pickup times against what was scheduled. This report is based on trip checkpoint data — not trip status changes — so it measures real-world timing at the pickup location.
What This Report Tracks
This report focuses on two specific trip checkpoints:
- Spot Time (Vehicle at Pickup Location) — When the driver actually arrived at the pickup location versus when they were scheduled to arrive
- Customer in Vehicle (Pickup Time) — When the passenger actually got in the vehicle versus when the pickup was scheduled
The report does not track when trip statuses were changed in the system (e.g., when a dispatcher marked a trip as “En Route” or “On Location”). Instead, it compares the scheduled checkpoint times to the occurred (actual) checkpoint times recorded by the driver app or dispatcher.
Availability
This report is available on LA Black accounts. If you do not see it in your navigation, contact the sales department about upgrading.
How to Access the Report
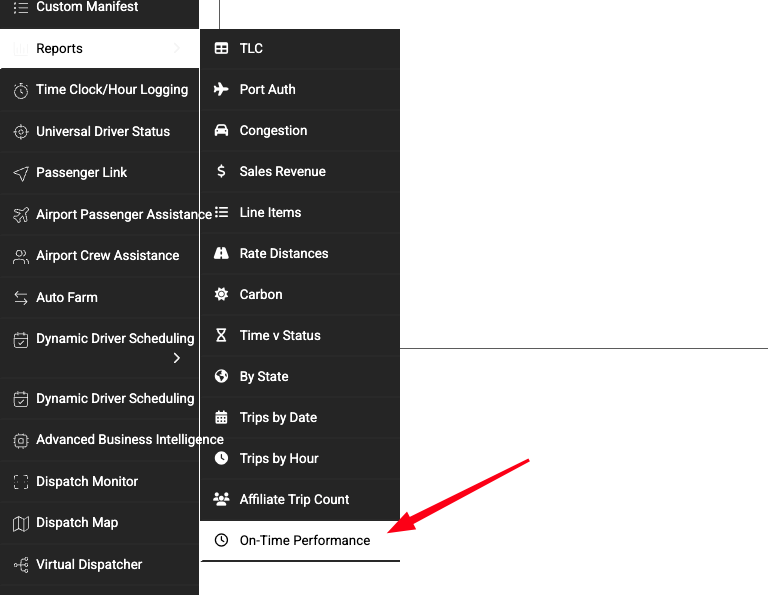
- Navigate to Reports > On-Time Performance in the left sidebar
Generating a Report
- Select a Start Date and End Date for the period you want to review
- By default, the report shows the last 7 days
- Set the Early Threshold (minutes) — how many minutes early a driver must arrive to be flagged as “early” (default: 5 minutes)
- Set the Late Threshold (minutes) — how many minutes past the scheduled time before a driver is considered “late” (default: 5 minutes)
- Click Generate Report

Understanding the Results
The report displays two tables:
Driver Performance Summary
This table gives you a high-level view of each driver’s punctuality over the selected date range. It includes:
| Column | What It Means |
|---|---|
| Driver Name | The driver assigned to the trip |
| Total Trips | Number of completed trips in the date range |
| Times Late | How many trips where the driver picked up the customer later than the late threshold |
| Avg Minutes Late | The average number of minutes late across all late trips |
| % Trips Late | The percentage of total trips that were late |
| Early + On-Time | Number of trips where the driver was on time or early |

- Green — 10% or fewer trips late (good performance)
- Blue — Between 10% and 20% of trips late (needs attention)
- Red — More than 20% of trips late (poor performance)
Trip Details
This table shows every individual trip in the date range with detailed timing information:
| Column | What It Means |
|---|---|
| Conf # | The reservation confirmation number (click to open the trip) |
| Driver Name | The assigned driver |
| Scheduled Spot Time | When the driver was supposed to arrive at the pickup location |
| Occurred Spot Time | When the driver actually arrived at the pickup location |
| Scheduled Pickup Time | When the passenger was scheduled to be picked up |
| Occurred Pickup Time | When the passenger actually got in the vehicle |
| Spot to Pickup Delta | The difference in minutes between when the driver arrived and when the pickup was scheduled (positive = arrived after scheduled pickup, negative = arrived before) |
Individual time cells are color-coded:
- Green — On time (within the early/late thresholds)
- Blue — Early (arrived before the early threshold)
- Red — Late (arrived after the late threshold)
How the Timing Data Is Captured
The times shown in this report come from trip checkpoints. Checkpoints are recorded when:
- A driver uses the Driver App to mark statuses like “On Location” (spot time) or “Passenger on Board” (pickup time)
- A dispatcher manually updates the trip status from the Dispatch Monitor
If a checkpoint was never recorded for a trip (for example, the driver didn’t mark “On Location” in the app), those columns will appear blank for that trip.
Exporting the Report
Both the Driver Summary and Trip Details tables can be exported. Use the buttons in the top-right corner of each table to export as:
- CSV
- Excel
Tips and Best Practices
- Adjust thresholds to match your standards. If your company considers anything within 10 minutes acceptable, set both thresholds to 10 instead of the default 5.
- Review weekly. Running this report weekly helps you catch patterns before they become problems.
- Use the Driver Summary to identify coaching opportunities. Drivers consistently in the red zone may need route planning assistance or schedule adjustments.
- Ensure drivers use the app consistently. The report is only as accurate as the checkpoint data. If drivers don’t mark their statuses in the Driver App, the report will have gaps.
- The Spot to Pickup Delta is especially useful. A negative number means the driver arrived before the scheduled pickup — exactly what you want. A large positive number means the driver arrived after the passenger expected to be picked up.
Troubleshooting
- Report shows no trips — Make sure you have trips with assigned drivers in the selected date range. Cancelled and deleted trips are automatically excluded.
- Occurred times are blank — The driver did not record the checkpoint in the Driver App, or the dispatcher did not update it manually. Encourage consistent use of the app.
- Times seem wrong — The report converts all times to your system timezone. Verify your timezone is set correctly under Settings > System.